Baby Boom
Title
Baby Boom
Creator
Bill of Rights Institute/Flickr
Subject
Birth rates
Description
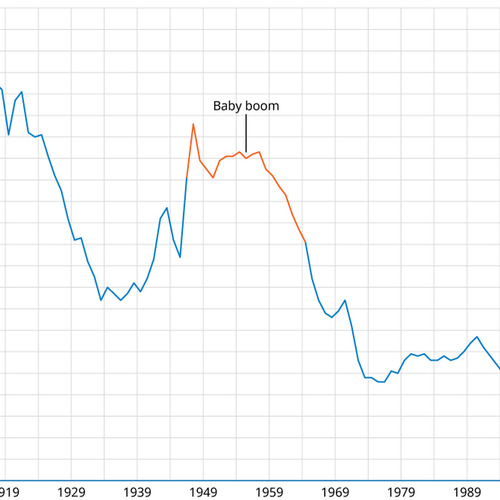
Graph showing birth rates over time from 1909 - 2009. The x axis is the time period in years and the y axis is the births per 1000 population per year. The red portion is the baby boom that occurred during the 1950s.
Publisher
Bill of Rights Institute
Citation
Bill of Rights Institute/Flickr, “Baby Boom,” Santa Clara University Digital Exhibits, accessed January 30, 2026, https://dh.scu.edu/exhibits/items/show/3663.
Embed
Copy the code below into your web page
Item Relations
This item has no relations.
