Visualizing Indian American Immigration
Shanta Gangolli is a First-Generation Indian American immigrant. She moved from Bombay, India to the U.S. in 1958. Based off of the details she shared in the transcript embedded below, I have created a map tracing the geographic locations of her initial immigration to the U.S., her children (Second-Generation Indian Americans) and her grandchildren (Third-Generation Indian Americans). This is meant to help visualize what an Indian American family might look like spread out amongst generations.
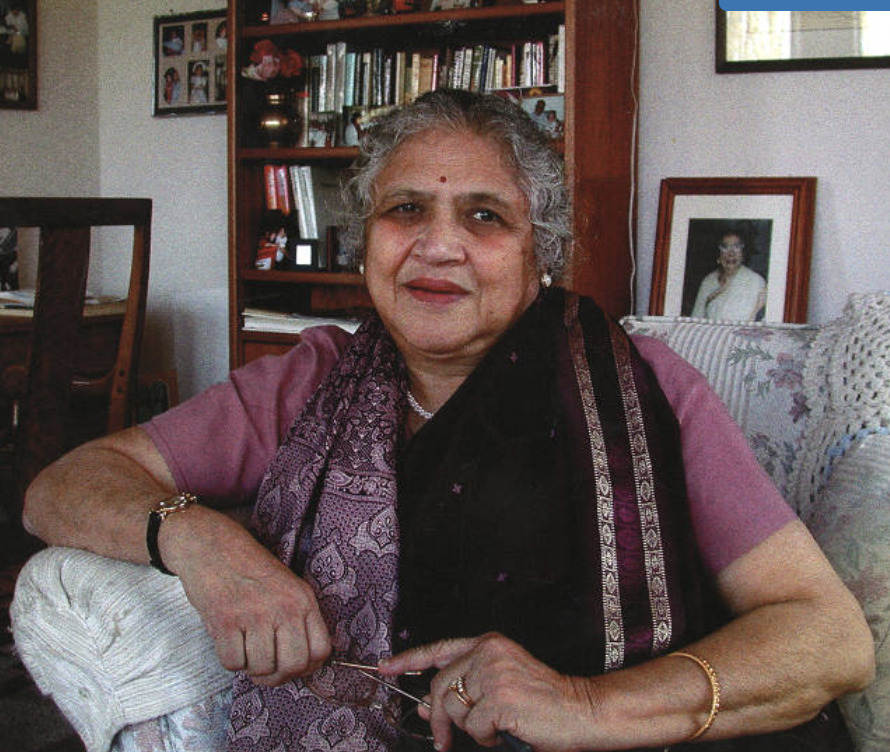
Shanta Gangolli Interview Transcript:
Featured below are two interactive maps taken from the Migration Policy Institute (MPI) Data Hub that illustrate where immigrants live today in the U.S.
To set the maps to depict data about Indian American Immigrants, go to the dropdown menu under the map and select India as country/region of origin.
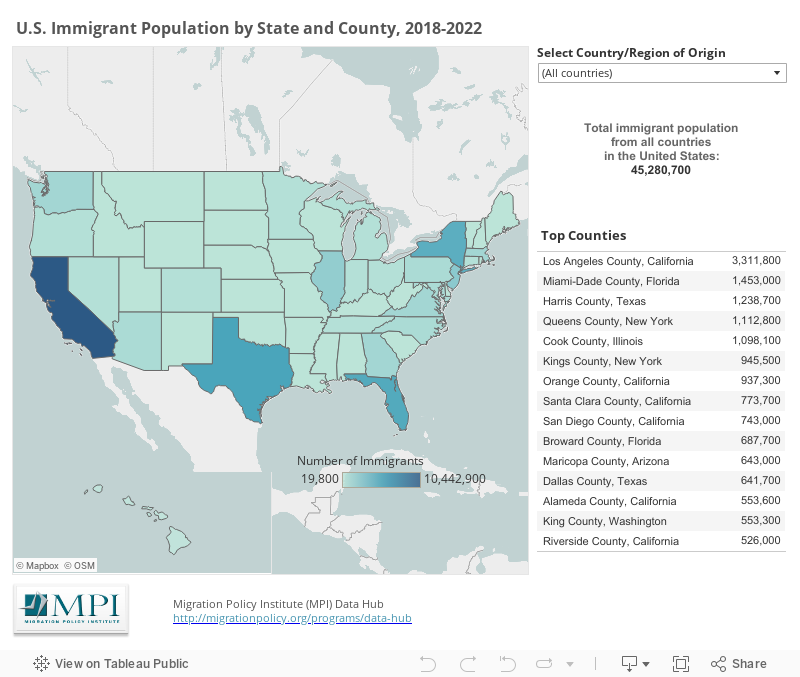
This map displays the geographic distribution of immigrants in the United States by country of origin.
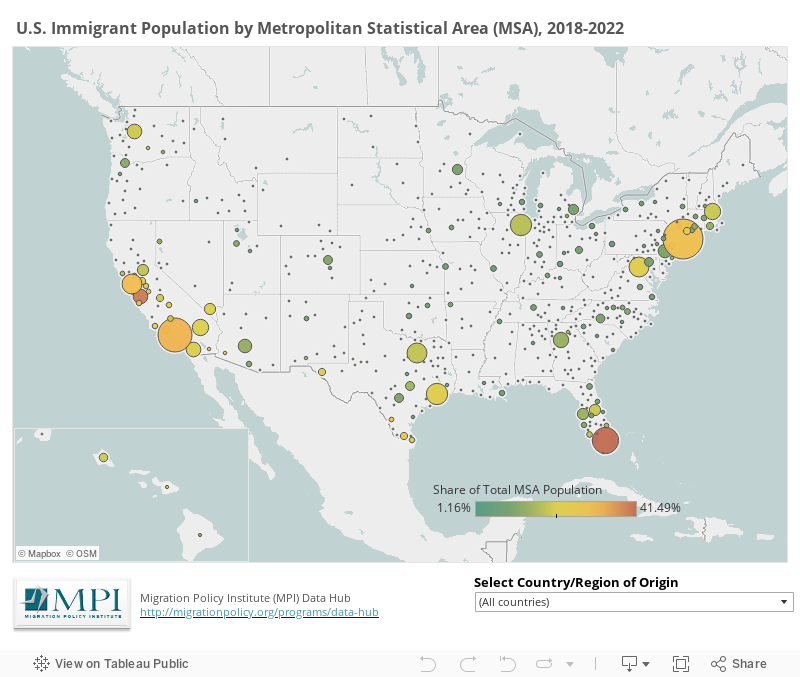
This map displays the metropolitan areas in which large number of immigrants resided during the 2018-2022 period. The colors represent the immigrant share of the total population for the metro area, and the bubble size reflects larger concentrations of immigrants.